
VIP DASHBOARD
A ‘HOW TO’ GUIDE
Our interactive VIP dashboard has been developed in partnership with Qlik.org, the corporate responsibility arm of the leading data analytics company Qlik and long-term WeSeeHope partner. It analyses the economic and social data collected from every savings and loans group formed since we launched our Village Investors Programme (VIP) in 2014, up until the moment that they are operating independently of our support.
The VIP dashboard pulls and analyses information from an internal database that is populated with:
- Group start-up data: This comes from “start-up” forms populated by our partners every time a VIP group is established. It includes baseline information such as group membership and the number of children supported.
- End of cycle data: This comes from ‘end of cycle’ forms populated by our partners every time a VIP group completes a share-out. It includes the amount of money in each of the funds and how many members’ purchased animals.
HOW THE VIP WORKS
To best understand the dashboard, it’s important to understand what the VIP does and how it works.
Our VIP establishes savings and loans groups for parents and guardians of vulnerable children who do not have access to formal financial services, and the community volunteers who run our other programmes. We teach VIP members community banking, financial and entrepreneurial skills, helping them to earn and save a regular, safe and sustainable income, and improve their family’s wellbeing.
The VIP model is self-funded and self-regulated as groups only use internally generated funds. In every community where we work, the VIP follows the same process.
- VIP group members attend regular meetings where they each deposit money into a Savings Fund. Loans are then made from this to members who make a request and are approved by the rest of the group, and an interest rate is agreed.
- With their loans and knowledge from financial and entrepreneurial training sessions, members establish or improve a business. They then use profits to pay back their loan into the Savings Fund and their interest is put into the group’s Interest Fund.
- To make sure their meetings run smoothly and on time, members are required to contribute to a Fines Fund if they arrive late or break any of the rules of the group.
- Each VIP group is encouraged to set up a group income generating activity (IGA) to further build the capital of the group, the profit from which is put into the IGA Fund.
- During every meeting, members contribute towards a Welfare Fund, which provides emergency interest-free loans for any member in times of hardship, and an Orphan Fund, which helps children in their community who are in extreme need of support with food, school fees, and other necessities.
- At the end of each savings cycle, which is usually annual, the groups “share-out”. This is when the Savings, Interest, Fines and IGA funds are divided among members depending on how much they have saved as an individual throughout the cycle. Members then reinvest back into the group and start a new savings cycle.
Every VIP group is trained for three to four years, at which point they graduate from the programme as they can operate independently of any support.
HOW TO USE THE DASHBOARD PAGES
The VIP dashboard has two pages:
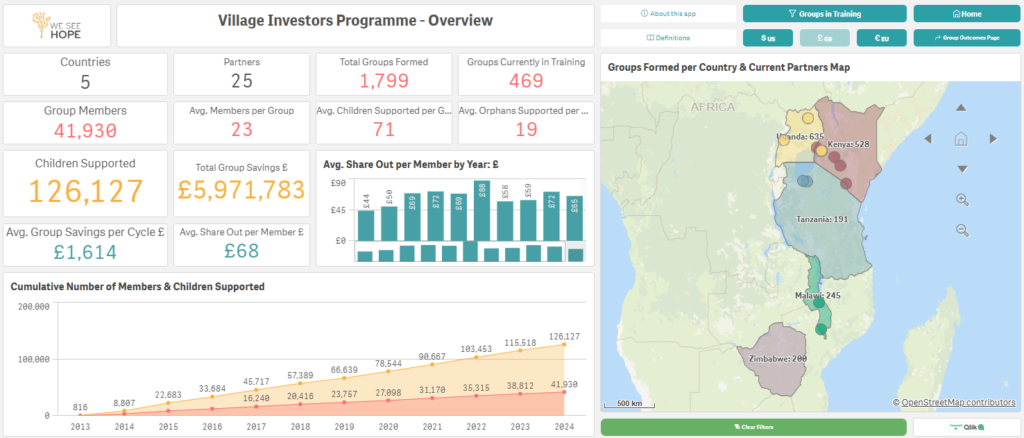
- Group Overview Page: A cumulative overview of all VIP groups formed since the programme was launched.
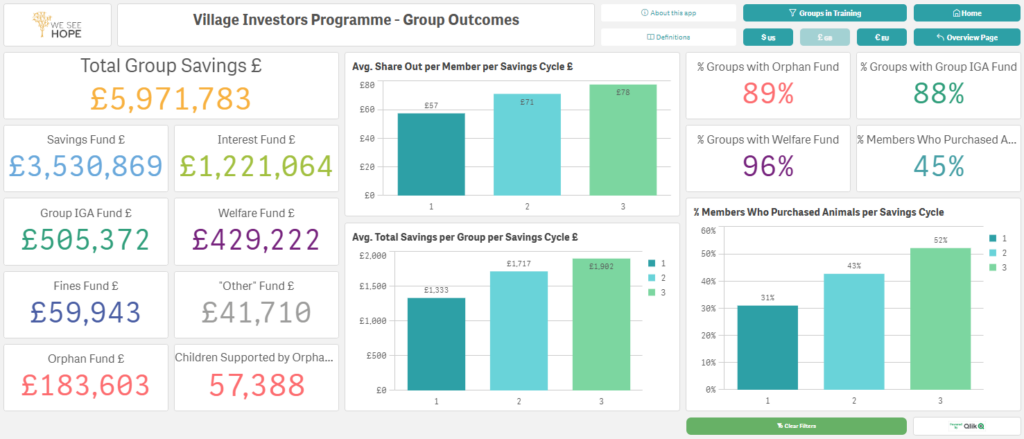
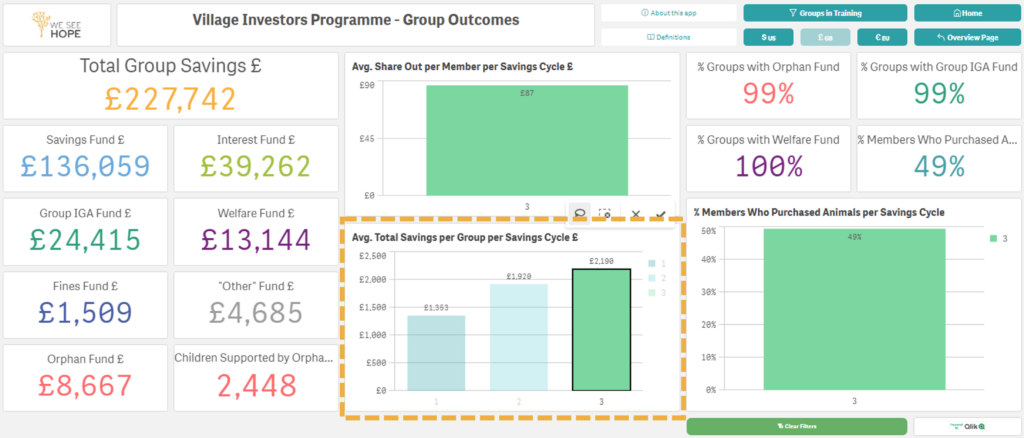
- Group Outcomes Page: A cumulative overview of all VIP groups’ outcomes since the programme was launched.
Without any filters on, the cumulative data on both pages includes groups that:
- Are currently being trained and supported.
- Have graduated from the programme and can operate independently of any support.
- Were set up and trained by our former partners.
- Are no longer functioning due to economic, environmental or practical reasons.
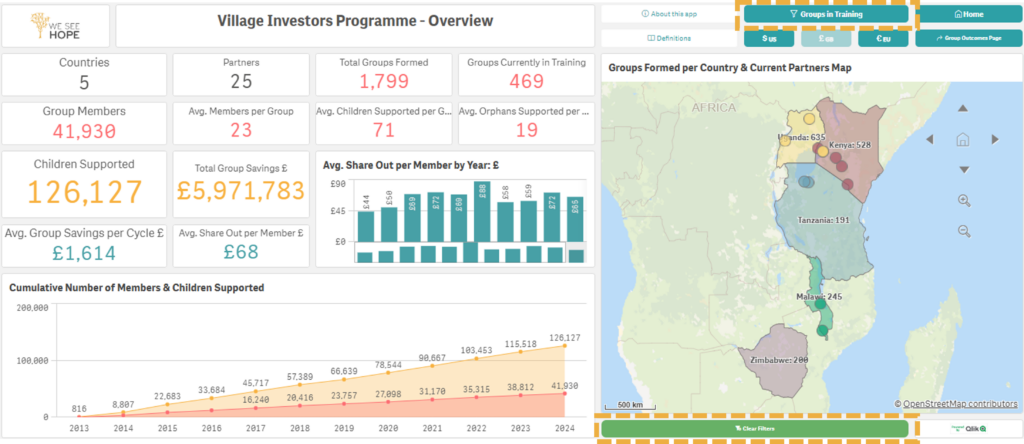
To navigate between the two pages, use the buttons at the top right hand side of the dashboard, as shown below.

HOW TO USE THE “GROUPS IN TRAINING” FILTER
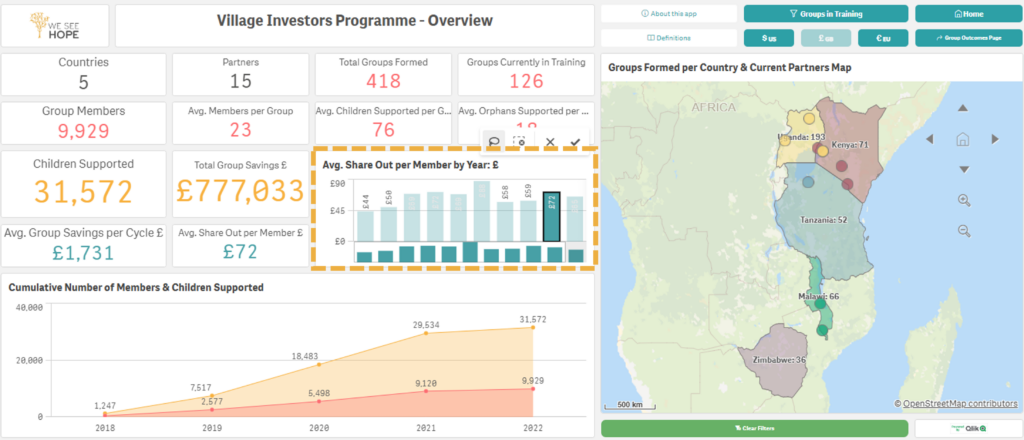
In order to see only the data for groups that are currently in training on both pages, click on the ‘Groups in Training’ filter. If you want to revert back to seeing cumulative data for all groups, click on the same button which now says ‘All Groups,’ or click on the ‘Clear Filters’ button.
HOW TO CHANGE CURRENCY
On both pages you can change between GBP, USD and EUR currencies using the buttons below to change the financial figures.

HOW TO USE THE MAP
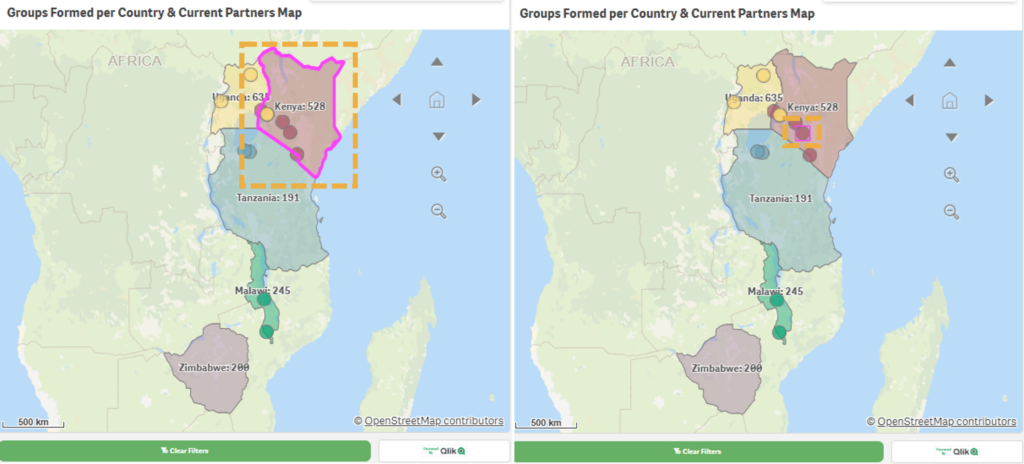
On the Group Outcomes page, there is an interactive map which you can filter in two key ways:
- By country: Click outside the small dots and all data will be filtered per country (see below left)
- By partner: Click on the small coloured dots and all data will be filtered by the partner with whom we are running the VIP (see below right). In areas where we are working with a number of partners, you will need to zoom in on the map to differentiate between them. If you hover over the dots, you will see the name of the partner and location, in addition to the total groups they have formed.
HOW TO USE THE CHARTS
The bar charts on the two pages function as interactive filters which you can use to drill down into the dashboard data.
- On the Cumulative Number of Members and Children chart (Group Overview page), you can click on the bars to filter the data by group start year. This will filter to the data of groups that were started in that particular year only.
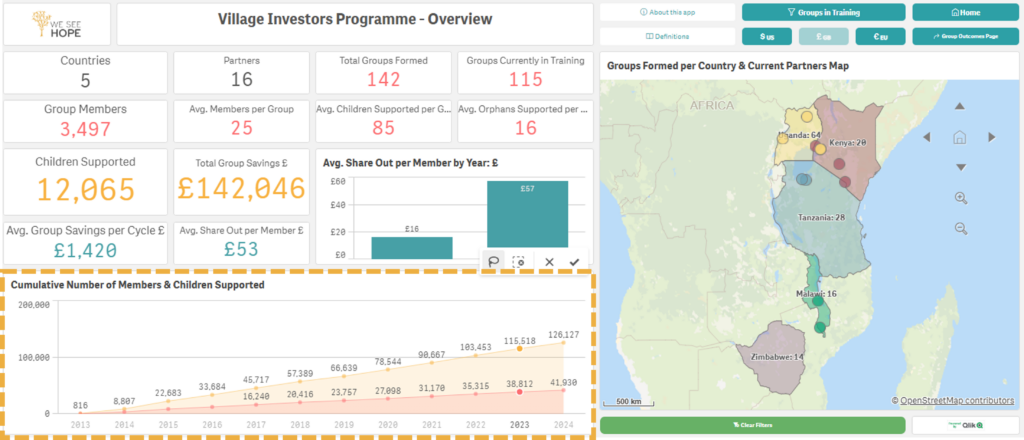
- On the Avg. Share Out per Member by Year chart (Group Overview page), you can click on the bars to filter the data by share-out year. This will filter to the data of groups that had a share-out in that particular year only.
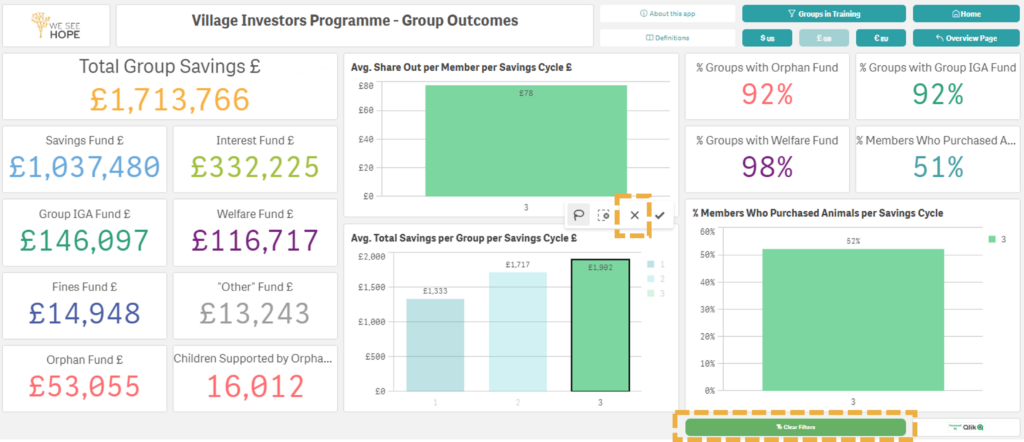
- On the Avg. Share Out per Member per Savings Cycle, Avg. Total Savings per Group per Savings Cycle and % Members Who Purchased Animals per Savings Cycle charts (Group Outcomes page), you can click on the bars to filter the data per savings cycle.
HOW TO REMOVE FILTERS
To remove any filters, click the green ‘Clear Filters’ button on the bottom right hand side or the red “X” button.
HOW TO KNOW WHAT EVERYTHING MEANS
Alongside the VIP dashboard and this ‘How To” Guide, we have created a definitions index to help you understand what the different points of data mean and why they are important.
TROUBLESHOOTING
This dashboard has a responsive web design, meaning it adjusts depending on the size of the screen being used to view it. For this reason, you might not be able to see the labels on the charts’ X-axis. For best results, we recommend viewing on a desktop. Additionally, you can change the zoom on your web browser to 90% or 80% instead of 100% in order for the labels to appear.
HOW TO GET IN TOUCH
If you have any questions about the VIP dashboard or would like to speak to one of the team, please don’t hesitate to contact us at Hello@WeSeeHope.org.uk or on +44 (0)208 288 1196.