
CHH DASHBOARD
A ‘HOW TO’ GUIDE
Our interactive Child Headed Households (CHH) dashboard has been developed in partnership with Qlik.org, the corporate responsibility arm of the leading data analytics company Qlik and long-term WeSeeHope partner. It analyses the economic and social data collected from every CHH formed since we launched our CHH Programme in 2018, up until the moment that they are operating independently of our support.
The CHH dashboard pulls and analyses information from an internal database that is populated with:
- Needs assessment data: This comes from our needs assessment form that is populated by our partners when households are identified to join the programme. It includes baseline information such as their living situation and their immediate needs (e.g. food or school fees).
- Annual data: This comes from our annual data form that is populated by our partners at the end of each year of support. It includes data such as income made and the biggest changes seen over the year.
HOW THE CHH PROGRAMME WORKS
To best understand the dashboard, it’s important to understand what the CHH Programme does and how it works.
Our CHH Programme works directly with children who have been orphaned, abandoned or left to care for an elderly relative. No matter their age, they bear the responsibility of providing for themselves and their family. With our partners, we seek to provide the tools to enable them to better meet their needs by addressing both the short and long-term challenges these children face.
We work with each CHH for three years, at which point they graduate from the programme when they are in a better position to support and sustain themselves.
HOW TO USE THE DASHBOARD PAGES
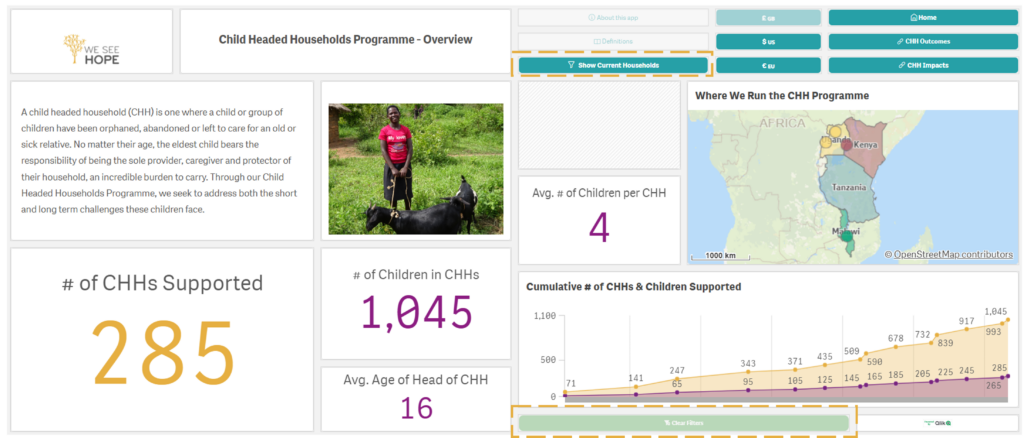
The CHH dashboard has three pages:
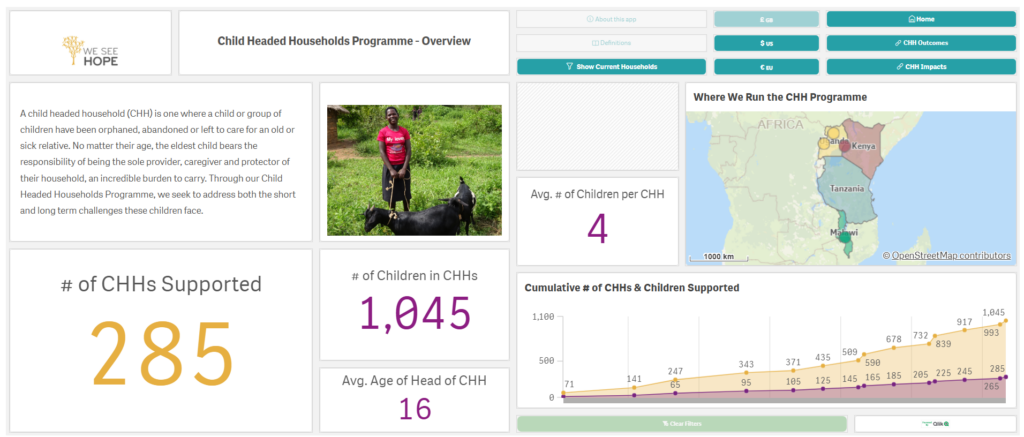
- CHH Programme Overview Page: A cumulative overview of all CHH’s supported since the programme was launched.
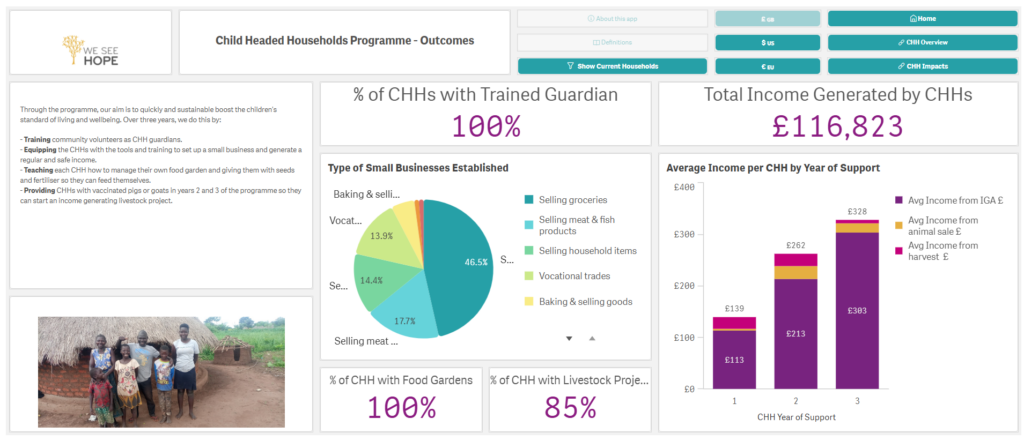
- CHH Programme Outcomes Page: A cumulative overview of all of the CHH’s outcomes since the programme was launched.
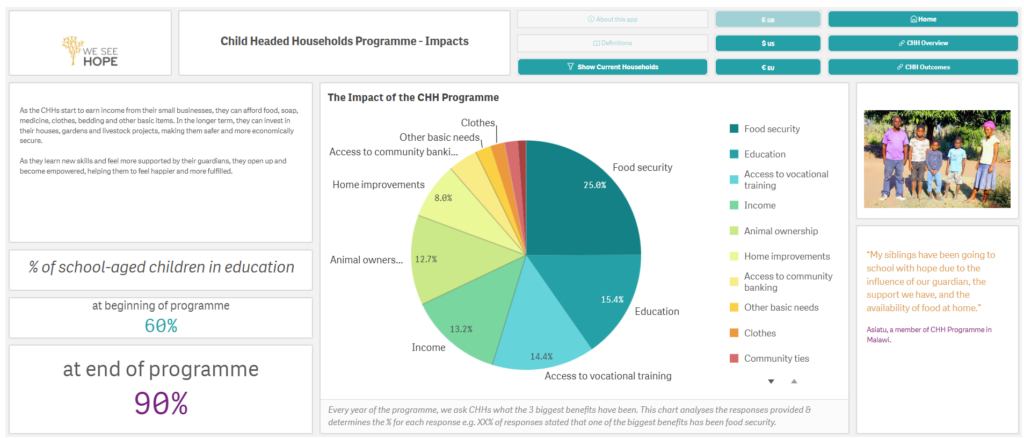
- CHH Programme Impacts Page: A cumulative overview of all of the CHH’s impacts since the programme was launched.
Without any filters on, the cumulative data on both pages includes households that:
- Are currently being trained and supported.
- Have graduated from the programme.
- Were set up and trained by our former partners.
- Only partially completed the programme.
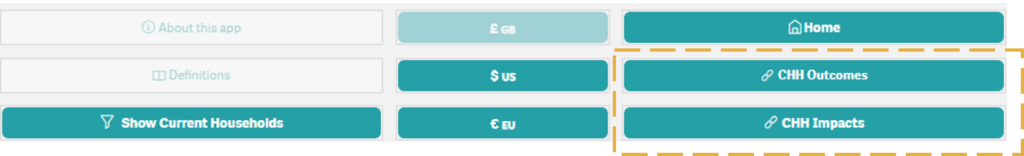
To navigate between the three pages, use the buttons at the top right-hand side of the dashboard, as shown below.
HOW TO USE THE “CURRENT HOUSEHOLD” FILTER
In order to only see the data for the CHH’s that are currently in training on both pages, click on the ‘Current Households’ filter. If you want to revert back to seeing cumulative data for all CHH’s, click on the same button which now says ‘All Households,’ or click on the ‘Clear Filters’ button.
In order to clear filters applied on the outcomes or impact pages, you need to return to the CHH overview page and select the green ‘clear filters’ button.
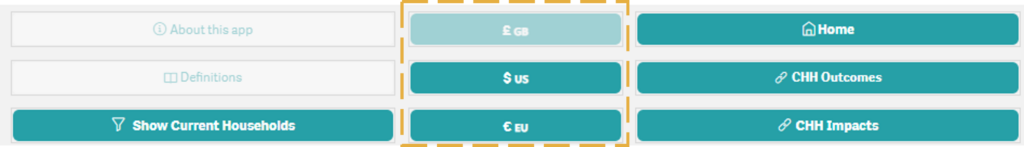
HOW TO CHANGE CURRENCY
On both pages, you can change between GBP, USD and EUR currencies using the buttons below to change the financial figures.
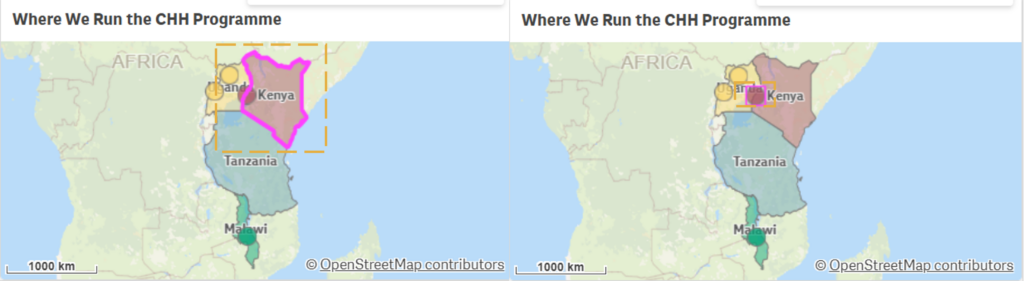
HOW TO USE THE MAP
On the CHH Overview page, there is an interactive map which you can filter in two key ways:
- By country: Click outside the small dots and all data will be filtered per country (see below left)
- By partner: Click on the small coloured dots and all data will be filtered by the partner with whom we are running the programme (see below right). In areas where we are working with a number of partners, you will need to zoom in on the map to differentiate between them. If you hover over the dots, you will see the name of the partner and location, in addition to the total households they have formed.
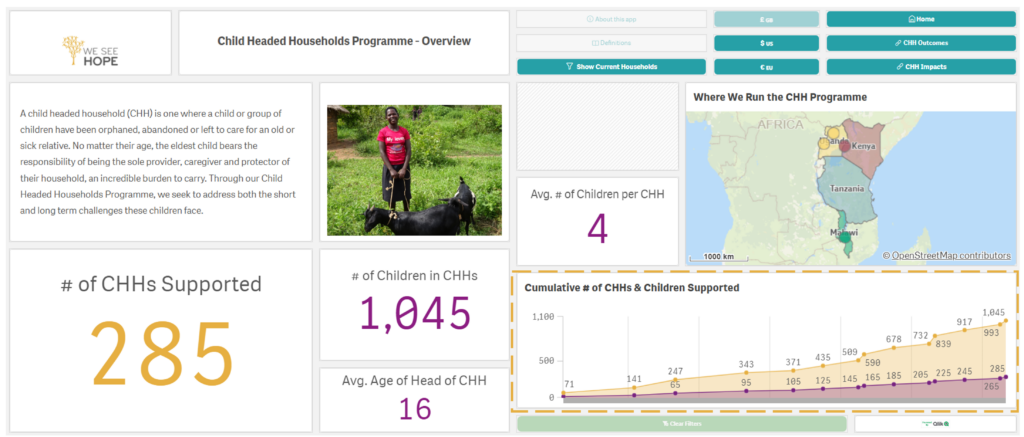
HOW TO USE THE CHARTS
The charts on the three pages function as interactive filters which you can use to drill down into the dashboard data.
- On the Cumulative Number of CHHs and Children Supported chart (CHH Overview page), you can click on the bars to filter the data by CHH start month and year. This will filter to the data of households that started training in that particular month and year only.
- On the Type of Small Businesses Established chart (CHH Outcomes page), you can click on the slices to only show data related to the small business selected on the pie chart.
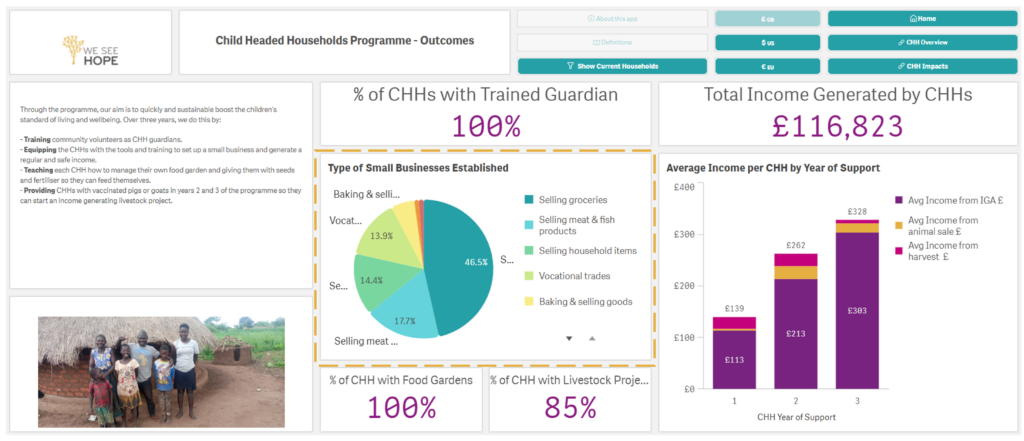
- On the Average Income per CHH by Year of Support chart (CHH Outcomes page), you can click on the bars to filter by year of support.

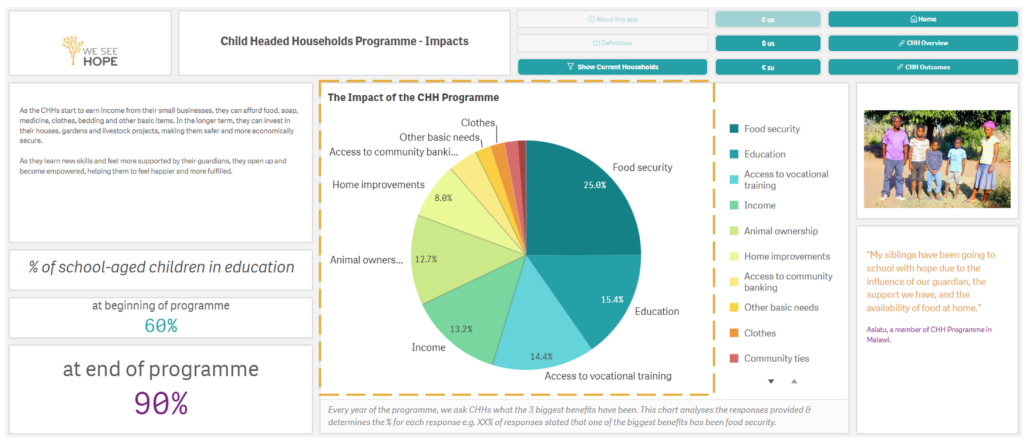
- On The Impact of the CHH Programme chart (CHH Impacts page), you can click on the slices to filter data by type of impact e.g. education.
HOW TO REMOVE FILTERS
To remove any filters, click the green ‘Clear Filters’ button on the bottom right hand side of the CHH overview page or the “X” button.

HOW TO KNOW WHAT EVERYTHING MEANS
Alongside the CHH dashboard and this ‘How To” Guide, we have created a definitions index to help you understand what the different points of data mean and why they are important.
TROUBLESHOOTING
This dashboard has a responsive web design, meaning it adjusts depending on the size of the screen being used to view it. For this reason, you might not be able to see the labels on the charts’ X-axis. For best results, we recommend viewing on a desktop. Additionally, you can change the zoom on your web browser to 90% or 80% instead of 100% in order for the labels to appear.
HOW TO GET IN TOUCH
If you have any questions about the VIP dashboard or would like to speak to one of the team, please don’t hesitate to contact us at Hello@WeSeeHope.org.uk or on +44 (0)208 288 1196.