
CHH DASHBOARD
DEFINITIONS
This definitions index is designed to be used alongside our Child Headed Households (CHH) dashboard so you can understand what the different points of data mean and why they are important.
PAGE 1: CHILD HEADED HOUSEHOLDS PROGRAMME – OVERVIEW
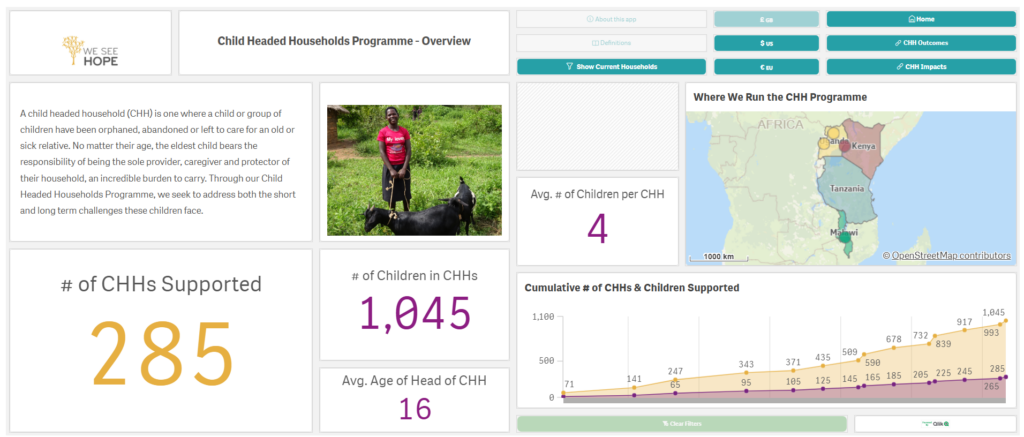
# of CHHs supported
The number of CHHs we have supported since the programme was launched in 2018.
# of Children in CHHs
The number of children within the CHHs that we have supported since the programme was launched in 2018.
Avg. Age of Head of CHH
The average age of the child that is the head of the household.
Avg. # of Children per CHH
The average number of children being supported within the CHHs.
Where we run the CHH Programme
A map showing the locations of our partners who are running the CHH Programme.
Cumulative # of CHHs & Children supported
A graph showing the cumulative number of CHHs supported by start-up month and year in purple. Also, the cumulative number of children supported by start-up month and year in orange.
PAGE 2: CHILD HEADED HOUSEHOLDS PROGRAMME – OUTCOMES
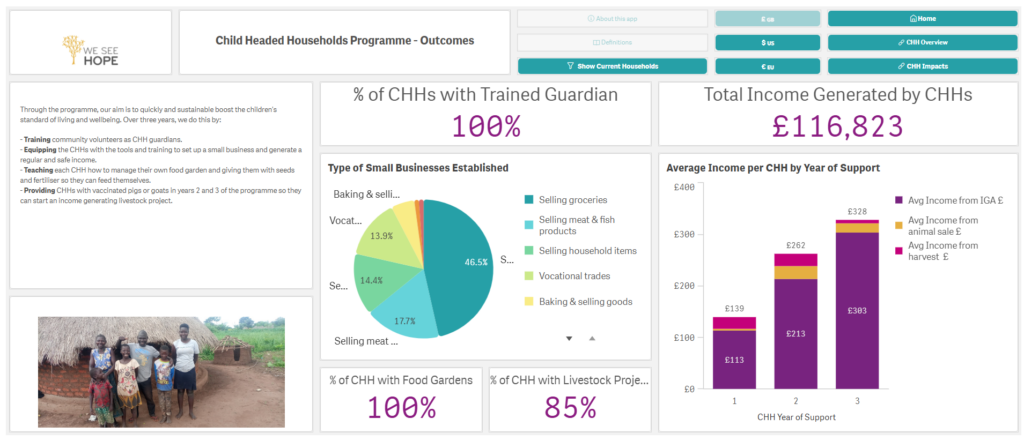
# of CHHs with Trained Guardian
The percentage of CHHs that have a trained guardian supporting them.
Type of Small Business Established
A pie chart showing the types of small businesses the CHHs are running and the percentage of how many households are doing each business.
# of CHHs with Food Gardens
The percentage of CHHs that have established a food garden to grow crops for sustenance and to sell.
# of CHHs with Livestock Project
The percentage of CHHs that have farm animals, such as goats or pigs, used to support the households.
Total income generated by CHHs
The total income generated by all CHHs from their businesses, animal sales, and harvests sold from their food gardens.
Average Income per CHHs by year of support
A bar chart showing the average income made by CHHs in each year of support. Also split by colour to show the average income made from their businesses, animal sales and harvest.
PAGE 3: CHILD HEADED HOUSEHOLDS PROGRAMME – OUTCOMES
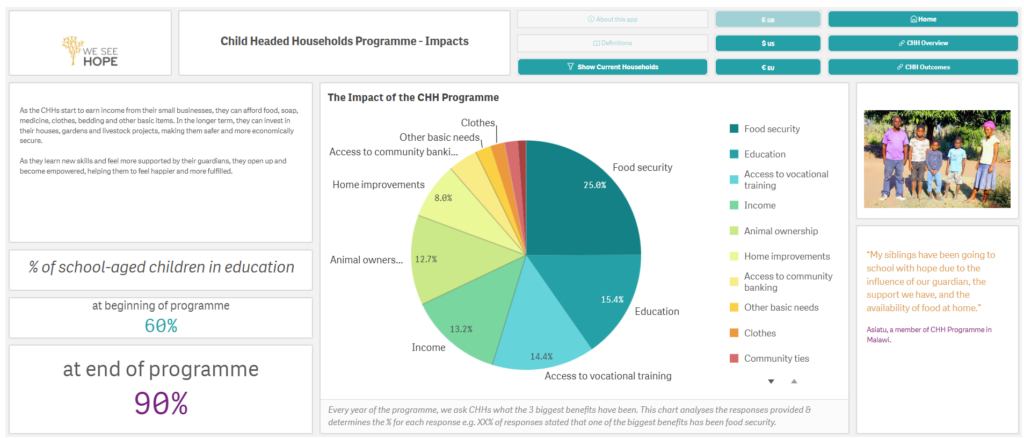
% of school-aged children in education
The percentage of school-aged children within the households that were attending school at the start of the programme vs the percentage of children attending at the end of the programme.
The Impact of the CHH Programme
A pie chart showing the different types of impact the CHH Programme has had on the households. Each year of the programme, we ask the CHHs what the 3 biggest benefits have been. This chart determines the percentage of each response.
GET IN TOUCH
If you have any questions about the CHH dashboard or would like to speak to one of the team, please don’t hesitate to contact us at Hello@WeSeeHope.org.uk or on +44 (0)208 288 1196.